Showing posts with label Electronics. Show all posts

November 21, 2014

Innocentive NASA Challenge: Medical Consumables Tracking

As I am not authorized to share the details of the challenge, as per the agreement signed by me, I am sharing the overall structure of the problem here. Once you are through you may now look for the solution that I submitted, some more than 4 years ago. 
I am omitting "My Solution: • Introduction and Background: " part; as it may divulge  information from the challenge itself, which is prohibited. The below portion has not been altered post-submission, even though I could find many faults looking back. [I particularly could better have done without resorting to the undue rigmarole under this subheading: "Electronic cascading method". Should have explained my idea in simple terms and perhaps with some schematic, self explanatory diagrams. What I really meant was that each box would be like an element in an array of a 3D matrix (where the 3D matrix represents the array of medicine boxes for each day), and that each element/box would be assigned a unique value identifying it, corresponding to their orientation in space. This could be achieved by a process similar to DTMF encoding. The actual counting would still be done optically and the data sent to a memory module/register. Counting could be implemented by cascading binary coded decimal (BCD) counters.]  Below is the submission, uncut. 

"• Detailed Description of the Solution: The requested problem may be solved in a much better way than being done by standard bar-code (UPC= Universal Product Code=bar code) in a number of ways: such as, quick access time, minimum medicine handling, far higher accuracy, holds more data and ‘potential’ tracking to the ultimate end-user. 
An RFID device (Radio Frequency Identification) may look like a rectangular card, a ring, a wristwatch, wrist band, a bracelet or anything we may want it to be of the ‘required’ shape. We will concentrate upon both the ‘passive RFID tag’ (fig. 4), a batteryless device; as well as an ‘active RFID’, a battery incorporating device having an inbuilt antenna. They may be used both in a spacecraft and aboard the ISS. Before describing them it is pertinent to point out that the astronaut wear an ‘active RFID reader’ (interrogator module), whereas the medication boxes will contain RFID tags. Although this will marginally increase the power consumption, but it will certainly save more box space.    

The ‘passive RFID label’ contains a batteryless circuit which may be inductively (Loop of wire) or capacitively coupled. Although we prefer the capacitively coupled one, here we briefly discuss the actions of an inductively coupled one, as it is easier to understand. A miniature in-built coil within the RFID label produces ‘induced electricity’ that powers the rest of the circuit, when it nears an RFID reader (the wristband). The EMF (from ‘induced electricity’) then transmits all the data, the RFID has been preloaded with. It may include user data, time, quantity in stock etc., which the ‘wristband or ring device’ sincerely relays to a nearby computer, PDA, mobile phone (??Service provider in Space!), or a USB memory stick.

RFID is already in use in tracking cattle, dispensing medicines, checking medical inventory, managing expired/counterfeit medicine, etc.; and it is approved by the FDA for most of those stated. The tracking may be employed in two major ways:

1). The conventional method: 
(Step A): The ‘inventory’ would be designed as shown in fig.1. A postage stamp has been pasted on the ‘main’ door to symbolize the ‘main’ RFID tag. Behind the main door are an array (fig.2 & 3) of medical boxes arranged in a week’s course (the grid may be modified according to need). Each day-numbered-boxes has their own unique ‘sub’ RFID labels (tags). These RFIDs have been exemplified in fig.3, as red/black circular pads. All the RFID tags will have information regarding the type of the medicine, quantity, expiry and other issues as needed. Quantity remaining will be conveyed by the passive RFID tags stuck to the boxes, when they are approached by RFID readers via RF communication to the server. It also records the identity of the person. Subtracting doses is done by knowing the drugs taken and in which amount. 
This is laser ‘optically’ determined (we can’t weigh them since gravity is virtually non-existent) or an ejection-related electrical contact system may emit an RF signal . Replenishing the inventory may be done in an analogous way. 

An audible/visible alarm may be preset on the day (or before as desired) of expiry of any particular medicine, injection etc., or when empty. This arrangement of boxes in the XYZ coordinates (fig. 3) will help us determine which meds are taken or needs refill.

(Step B): Each astronaut has his/her own specific RFID reader. Each reader is attached directly or by Bluetooth transponder to a nearby computer, PDA, mobile phone (??Service provider in Space!), USB memory stick, or any other server.

Example: Consider this scenario: Mr A volunteering to bring a caplet for Mrs B. Mr A goes to the inventory, brings his battery powered ‘active’ RFID reader enabled ‘wristband’ near the ‘main’ console which is ‘passive’ RFID enabled. ‘Active’ sends coded RF signal to the ‘passive’ RFID sticker. The ‘Passive’ device now knows the user’s identity from its database, sends back this info to Mr A’s wristband, which again relays info to the Flashdrive/PDA etc.. The ‘main’ console opens, allowing access to the individual boxes of pills to Mr A. Supposing, Mrs B wanted a pill of Calcium tablet, Mr A would this time use “her wristband/RFID reader” to individual boxes until he gets to the right rack (each box contains pre-encoded medications). He gets the caplet, her wrisband subtracts the total amount of the pill by ‘one’(this is done in the PDA/mobile/USB drive, with cues from optical/electrical signal, sent via RF). The pill has to be either ejected mechanically or the person have to finger-pick them (the box has to be bigger then). 
Thus, we know who opened and who was the actual recipient (patients’ information system, or PIS). Obviously, we did not see Mrs B ACTUALLY taking it, but we may rely on the cosmonauts’ honesty. Otherwise, optical monitoring/radiolabelling of medicines have to be done (this is NOT desirable)! [We may however, implement capsule endoscopy containing actual active ingredients too (and videograph/send RF signal, as well)!]

Here at this stage we need to use a software to do all the tedious job for us. Software programs are written using HL7 organisation protocols (Health level seven is an American National Standards Institute accredition organisation). The server processes data received from PIS. The server would have no problem forwarding the medication related information to a physician.

2). Electronic cascading method: 
The medication array remaining the same, we may encode each ‘box’ a specific tune (frequency) just as we do in DTMF (dual tone multi frequency) telephones. These frequencies will provide us with the requisite address/bus location, in addition to relaying to a centralized server. Electronic counter low power CMOS integrated circuits incorporating overflow (for cascading signals) like 4553 may be employed. They may be interfaced with 74HC4543 BCD to 7 segment decoder ICs to produce visible LED digit displays for the astronauts, alarms; or they may be FSK-ed (frequency shift keying) to a database and transmitted as required.

In either case, the volume and weight of the inventory will easily be within the specified limits, provided not too many medicines are required by the persons.

PS: Ready made medicine dispenser with builtin inventory and alarm are available in the market. I have included some such sites in references.

References and Notes: 
http://www.openpcd.org/
http://en.wikipedia.org/wiki/Radio-frequency_identification
http://www.rfidjournal.com/article/print/778 (smallest rfid reader)
http://www.rfidcardreaders.com/rfidreaders.htm (rfid reader interfacing)
http://www.eng.tau.ac.il/~yash/kw-usenix06/index.html (how to build an RFID skimmer)
www.eahp.eu/content/download/25218/164530/file/DugDistribution71-73.pdf.pdf (USING AUTOMATED DISPENSING MACHINES)
www.rfidjournal.com/article/articleview/1511 (RFID and Emerging Technologies Market Guide to Healthcare)
www.rfidjournal.com/article/articleview/3777 (Radio Frequency Identification in Health Care)
www.rfidjournal.com/article/print/7713 (Hospital RTLS Tracks Pumps' Status and Movement)
www.rfidjournal.com/article/view/7671 (USAF Boot Camp Tracks Boots)
http://www.iautomate.com/products/RFID-PC-Security-Kit.html (RFID PC Security Kit)
http://www.ftc.gov/os/2005/03/050308rfidrpt.pdf (FTC "Radio Frequency Identification: Applications and Implications for Consumers" (March 2005))
http://www.epill.com/medtime.html (AUTOMATIC MEDICATION DISPENSER)


Attachments:
Fig 1, Fig 2, Fig 3, Fig 3a, Fig 4

• Supporting Information: vide References 

• Conclusion: This solution is likely to conform to the ‘seeker’ standards, as it is:
gravity independent
Minimal hand work
Space saving
Accurate inventory tracking
Technically and financially feasible"

Addendum: links to Fig 1, Fig 2, Fig 3, Fig 3a, Fig 4
Last modified: never 
Reference: hyper-links, unless specifically mentioned

February 07, 2014

Revisiting the Sternocleidomastoids: Accessory Muscles of Respiration


We know that sternocleidomastoids (strap muscles of the neck), scalene muscles and alae nasi are considered accessory muscles of breathing, although some controversy exists. If you saw an asthmatic individual in his desperate attempts at breathing or an agitated person or a person exercising vigorously, you could watch these muscles in action. However, that wasn't exactly what I had in mind while I was doing this experiment. I was really thrilled to chance upon it. Kind of a serendipitous discovery in its own right. You too can figure this out easily. The placement of the surface leads were as shown on the right. Red dots were for the reference and recording electrodes whereas the blue dot represents the ground (as usual). 

The neck muscles of each side were tested one at a time. For example, This wav file (open it Audacity or BYB neuron recorder) was obtained from EMG recording from the right sternocleidomastoid; the leads were placed on the right side and the ground lead on the manubrium. The head was at mid-line (neutral position) to start with. Next, it was turned to the right, then midline again, then to the left (without any external resistance applied), then against resistance applied by the left hand. The muscle of the right side moves the head to the left. Finally, the head was again restored in its neutral position. An improvised notation could be N to R to N to L to L+ to N (Legend: N=neutral, R = right, L=left, L+ = left against resistance). 

Similarly, the left side was tested in a likewise manner (N to L to N to R to R+ to N). And this is the waveform obtained. The surprise awaited me, I was in for an ambush!

While the leads were still on the strap muscles of the left side of my neck, I observed the EMG waveform in real-time. I noticed that as I was taking a deep breath, the EMG activity increased significantly. I didn't have to turn to my head to the right anymore! I then maintained this position by holding my breath. The activity continued. Here's the recorded .wav file. The associated camera recording will speak for it (see below: Youtube). Yes, it proved that it was indeed an accessory muscle called in to address forceful inhalation. I then did a forceful exhalation, but no increase in EMG activity was observed, buttressing my observation. 


As you may have noticed that I have used the terms inhalation and exhalation, in lieu of, inspiration and expiration. Well, inspiration, it definitely is! Expiration? No way!
Further analysis still awaits.
Spikerbox recordings may also possibly illustrate simultaneous EMG activities in protagonist and antagonist muscles. More of these later.

To be continued............
Creative Commons License
This work by Amiya Sarkar is licensed under a Creative Commons Attribution 4.0 International License.

Last modified: never 
Reference: hyper-links, unless specifically mentioned

Making a Human Interface Device Using SpikerBox

Q said to Bond: It's activated by nerve impulses from the wrist muscles. This dialog from the 1979 James Bond movie, Moonraker, seems to fit into place when we talk about interfacing biosignals (surface EMG, in this case) with an actuator. [Watch a clip from the movie below]


In order to achieve this human-machine interface using our good not-so-old spikerbox, we need to estimate the output signal amplitude coming from the extensors of the wrist (around 5 mV), amplify the signal by some 300 times by cascading two LM 386 IC (or any opamp taking care that the device doesn't go into saturation) to about 1500 mV. We can then connect the output from pin 5 of the IC via the 250 MFD to a *1K resistor (* = value to be experimented with) to ground. Next we connect a wire from negative terminal of the electrolytic capacitor to pin 13 of CD 4066, a quad bilateral switch IC. The Boolean output (on/off logic) signal may then be driven into terminals of a 'laser pointer', whose push button terminals will have to be replaced by the output from pins 1 and 2 of CD4016/4066. A sketch of it is shown below. Pardon my bad drawing 'skill'! Interfacing should not be a problem as the power supply is 5V and CMOS ICs are happy with that.


Output level of LM386 is at half the supply voltage level (i.e. at 2.5 V). At +5mV signal level, voltage at pin 5 becomes 4.0 V [2.5 + (5*300*10^-3)], making the control pin of 4066 go logic high. A low resistance (250 ohm) path is established between pin 1 and 2 of this IC, hopefully switching the laser on. We better not play with darts at this moment!

Another idea is to hook up an optical mouse in such a way that its internal potentiometer is swapped with a twin light-dependent resistor (LDR) as shown below. The picture at the left/top panel shows the component side of the mouse and the soldered side at the right. The three leads in the rectangle 'marked' in the right/bottom picture panel on the soldered side may be replaced by the new pot using a twin LDR, as shown in the middle panel (its middle two leads connected to form the central/common lead of the new three terminal pot as shown in red arrows). 


The input maybe obtained preferably in stereo from the sternocleidomastoids of both sides. And the output amplified and fed into two LEDs separated by a window which communicate in a 'line of sight' with the 'twin LDR' setup. This would couple the two circuits (the SpikerBox setup and the laptop via the 'doctored' mouse) optically. The scrolling function (up/down) may then be undertaken by moving the neck sideways. The experimental setup may be as per this link. Details to be updated at a later date. You too may contribute.

Disclaimer: This circuit is a mere prototype, liable to have errors. I will check it at a later date, got to hone my electronic skill a little and get out of any further procrastination.

Creative Commons License
This work by Amiya Sarkar is licensed under a Creative Commons Attribution 4.0 International License.

Last modified: Apr20, 2014
Reference: hyper-links, unless specifically mentioned

Surface EMG from Thumb: Strongly 'Opposed' ?

Lead placement for the experiment, as shown on the right.
As I have already mentioned, the ground electrode sits atop
the manubrium sterni, on the upper chest (breastbone).

The camera recording is shown below. You can see the Piezoelectric crystal's spark and also hear its sound on snapping. However, I haven't yet had time to analyze if the spark did contribute some 'useful' static on the trace (open & watch this .wav file in BYB software).


Method: Pressing on a piezo crytal (from a cigarette lighter) by 'opposing' the thumb against the base of the little finger (as shown by the figure). Electrode placement shown in red & green markings [the ground electrode sits atop manubrium sterni]. Muscle (mainly) contracting is "opponens pollicis", a small, triangular muscle in the hand, which functions to oppose the thumb. [Strictly speaking, opposition of the thumb refers to the tip of the thumb touching the tips of other fingers. But that way, generating enough force without creating an unnecessary torque that topples the piezo is quite a challenge! After all, I had no assistant, and had to hold the camera too with the other hand]

Concept: A fixed and constant amount of force is necessary each time before the spring yields and the piezo fires. This end point is supposed to be caught in the trace 1) as a sharp spike after the surface EMG pattern or, 2) can be 'used' as a 'static'.

EMG amplitude and rate of spikes will need to be analyzed in short, discrete time intervals by simple counting.

Creative Commons License
This work by Amiya Sarkar is licensed under a Creative Commons Attribution 4.0 International License.
Last modified: never
Reference: hyper-links, unless specifically mentioned

February 06, 2014

Interpreting Rate Coding Data: Counting Spikes in a Tracing & Consequent Plotting of Firing Rate Versus Time

We acquire data by using the following device configuration (the green laptop cable will go to the laptop mic input, running on battery power) as shown below. Please see this link to learn about the anatomy of a coaxial cable, so that you can make a ground connection off a coaxial cable.

You can also take the ground off the reference point used for the Faraday cage clip, if you'd like. Incoming analog signals from the spikerbox will go into the internal ADC (Analog to Digital Converter) of the Conexant HD audio port of the laptop, whence the signal will be digitally processed. After a signal has been stored either in Audacity or in the BYB neuron recorder, we can open the'.aup' or the '.wav' file respectively later.

Here, I am attaching a typical wav file captured by striking the quadriceps tendon with a percussion hammer (knee jerk). This is a deep (tendon) reflex. I'll post more on this later. You need to open it using either of the two softwares listed. I am posting a screenshot on the right.
You can see three large spikes in the tracing. These spikes are actually not single/solitary, as they might innocuously suggest, but they are a conglomeration of many individual ones.

The below tutorial explains how to interpret these raw data.


By the way, there's no simple way to count spikes! First, we need to define spikes. We can fix an arbitrary threshold, beyond which we will label them as one. Here are some very rudimentary thoughts on counting:
  • Coupling/buffering the output from the laptop audio-out port via ICs like ULN 2004 Darlington transistor arrays to drive filament lamps [these filament lamps are a modest way to an integrator as the heat takes time to dissipate off]. The more the spike rates, greater will be the brightness. Then pick-up this optical signal by an LDR (Light Dependent Resistor) and then noting the resistance change [precalibration is necessary]. We can use capacitors too (using their exponential charging/discharging equations) or a linear optocoupler like MOC5010.
  • Software: writing some code snippets to Matlab/Python programs 
  • Using a Foster-Seeley phase discriminator: However, a new algorithm should be developed.
  • Converting the electrical signals to mechanical tracings on a rotating Kymograph [speed adjusted] may make it easier to read and count
  • Allowing only signals above a certain 'predefined' threshold voltage to pass through. We may use diodes for this cut-off estimation. Next, employ a CD 4520, a dual 4 BIT binary up counter that advances from LOW to High transition on clock input '0' (CK0) when CK1 is high, after the signal has been "gate"d . We can use an appropriate crystal to this counting purpose. Many optically based circuits are available on the net.
  • We can think of using a frequency to voltage converter IC like LM 2907
  • But presently, i'll be counting them manually. My time limitations and fading electronic experiences precludes any pursuits of above kind.
After we have successfully counted the 'rates' of 'action potential's, we can plot their number/spikes vs time plot in a linear or logarithmic scale. 


Here's where I positioned the ground electrode, on the manubrium sterni, on the upper chest (breastbone). The overlying hairs had been shaved and cleaned with spirit to reduce the input impedance. In all the spikerbox experiments the placement of the ground remained the same unless otherwise stated. 

To be continued....

Creative Commons License
This work by Amiya Sarkar is licensed under a Creative Commons Attribution 4.0 International License.

Basic Concepts and some 'Assumptions' in SpikerBox Biopotential Experiments

Exploring signals of very low amplitude, as is usual in most bioelectrical signaling, is not an easy job. In many instances the power line hum often drowns these weak electromagnetic dialects. In fact, our body acts as an antenna in receiving these wayward disturbances. We can curb these interference by the following means:

  • Opting for battery operated power for the sensing device (the bio-instrumentation amplifier) as well as the data acquisition inputs, for example, a laptop that runs on battery. The brightness of the laptop display maybe set to maximum, as some laptops may emit significant stray noise when brightness is not saturated.
  • Switching off any fluorescent lights
  • By proper Earthing of the equipment
  • Using differential op-amp configuration for adequate noise suppression by eliminating common mode signals
  • Using a preamplifier; and coupler gels that reduce electrical impedance (resistance) between the electrode (lead) and the body surface
  • Choosing an operational amplifier having a high CMRR (common mode rejection ratio)
  • By using a unity gain amplifier (voltage follower) configuration that has a very high input impedance
  • Employing a noise cancelling mechanism like the 'right leg driver'
  • Using a Farady Cage for effective 'shielding' from electromagnetic interference (static)
  • Employing a hardware filter (band stop or Notch filter) or a software program to eliminate/reject a particular frequency band (e.g. 50 Hertz or 60 Hz cycle frequencies)
There's many more options to tackle the undesirable gatecrasher, the 'hum'. Yet it is so difficult to achieve. Easier said than done!

To probe a physiological or pathophysiological response, a stimulus requires that it be precise/ accurate in timing, amplitude, reproducible, relatively less damaging and that it leaves a 'desirable' stimulus artifact so that we can calculate the delay in response in the tracing. Of the various types of stimuli available we generally prefer electrical stimulation over others; such as, mechanical, thermal and chemical, for the above reasons. 

Yet, we sometimes need to take recourse to other forms; as I was kinda forced to use mechanical stimulation to elicit a 'knee jerk' or that I had to abandon an interesting project (Hoffmann's reflex) as the TENS (Transcutaneous Electrical Nerve Stimulation) unit would invariably inject more than enough electromagnetic static into the waveform to render it useless. Marking the exact instant of an applied mechanical stimulus is bothering. I tried to circumvent this by making an "induction circuit", the makeshift switch of which
would be placed on the patellar tendon and 'close' on tapping by a hammer, thus sending an intended static. Also tried to sandwich a piece of piezoelectric material between the percussion hammer and the quadriceps tendon. But none worked so far. I had to remain contented by recording with a camera simultaneously, so that it picked up the sound of patellar impact!

The experiments I have done so far were mostly on obtaining 'surface Electromyography (EMG)' and nerve conduction velocity studies (NCV or NCS). The signals were fed into the SpikerBox input through coaxial cables into its RCA jack inputs, where it was amplified by an integrated circuit (IC) INA 2126P, an Instrumentation Amplifier. There was also a provision for rendering the electrical impulses 'audible' following amplification of the signal by LM 386, which was set at its default gain of 20. [For a more complete detail, please visit "Backyard Brains Wiki"] Thus, we could hear the action potentials and also interface the output with a laptop or a smartphone by softwares such as Audacity, Backyard brains neuron recorder (my own personal favorite) etc for real-time viewing, as well as, for recording for later storage, retrieval and analysis. 

The EMG recordings was done when the muscles were at rest, and at exercise: isometric or isotonic. Since I do not have a 'force transducer', a 'dynamometer' or a Mosso's ergograph; I had to invent ways to measure force/'work done' by other ingenious (or ingenuous? only time will tell !) means. Here's some:
  • spring constant (Hooke's Law) of the device maybe obtained by calibrating with a known device and by measuring how far the cylinder moves into the outer barrel (there's a spring inside that snaps hard onto a piezo crystal when force is applied).
    Piezo based cigarette lighter producing high enough voltage causing a spark thus igniting the gas 
  • by coupling it to a linear potentiometer which have also been previously calibrated (see figure), and then displaying the resistance in a multimeter or through a linear dot/bar display using LM 3914 IC.
  • Work done = Force*Distance=m(mass)*g(acceleration due to Gravity)*displacement (see schematic diagram)
Although we would love a stereo output from a 2 channel SpikerBox, the one I have, I do not have a laptop that accepts stereo microphone input.  Stereo signals are more preferable to human interface devices than plain old mono input. A stereo signal 'may' still possibly be 'recorded' by a 
  • Desktop line-in (via Avance AC97 soundcard) input but that would entail 50 Hz hum to pass through as well. 
  • A stereo (tape/CD) recorder running on battery power is a better option. The data can later be played/digitized at a later time. 
  • A stereo FM transmitter or a 3 pin to USB adapter is yet another option. 

Meanwhile, here's some relevant issues regarding Two channel spikerbox:
  • The internal connection pattern of (4 ring TRRS vs 3 ring stereo) 'smartphone'-'laptop' cable foxed me  for some time to realize that the Left & Right channels were only capacitively coupled
  • That my low-cost Penta T-Pad tablet could NOT render waveforms in BYB app while my Samsung GT-S5360 gleefully obliged. However, the screen was way too small to allow any reasonable analysis & that data longer than >=2 seconds could not be saved in the mobile
  • There was significant 'clipping'/distortion of the waveform in my mobile phone [maybe I could have attached a resistor to the ground/common pin to attenuate the signal. But I opted for not modifying the device in any way.]
Hence, I used the other cable coming from Y splitter (audio splitter) for the measurement of output signal amplitude, since I was outsmarted by my smartphone!

My tryst with such experiments is not new. I have previously done amphibian nerve-muscle preparation experiments using Kymograph and Dubois-Reymond induction coils, in medical curriculum. This included studying the effects of external influences like temperature, load, repeated stimuli causing beneficial effect & fatigue etc. on the tissue. I also studied peristalsis & effects of external influences including drugs on Guinea-pig smooth muscle in Dale's tissue organ bath. Also being an electronics enthusiast, I tried to decode the language the heart speaks, in the honest pursuit of making biomedical instrumentation. It's tough! (fun intended)

Lastly, all that has been said above may be modified as we gain more insight and experience. Please feel free to use/modify this work, do your own research, give your feedback or point something wrong in this article. 

N.B.-Remember, electricity kills! Try to have a close friend, preferably a doc, by your side. Check that the 'Earth' outlet is really what it outta be!

Last modified: never
Reference: hyper-links, unless specifically mentioned

Creative Commons License
This work by Amiya Sarkar is licensed under a Creative Commons Attribution 4.0 International License.

December 13, 2009

Fourier Analysis: The Art and Science of Finding The Needle in a Haystack

Every time I listen to the heavy metal band Pantera my wife would invariably wonder aloud why I listen to all this ‘noise’. True, many music lovers would rather refer bands like Pantera as quintessential noise than music; there are persons like me who can dissect the melody from the apparent chaos of runaway frequencies of guitars, drums and so on. I can even analyze and follow individual instruments over time. This is what Fourier is about, or stated otherwise, my ear & brain can be said to be doing a Fourier transform on the said musical piece.

a JPEG image of Joseph FourierJoseph Fourier, a French mathematician, realized that all periodic waves could be ‘synthesized’ by mixing sine waves of right frequency, amplitude and phase. For example, a square wave could be prepared by ‘adding’ the fundamental frequency (the lowest frequency; say 70Hz) with an infinite number of its odd harmonics (e.g. 210Hz, 350Hz, 490Hz and so on. Harmonics are multiples of the fundamental frequency.) This is Fourier synthesis. Similarly, you could break down a periodic signal in which the amplitude varies over time into one of a frequency versus time graph. This is Fourier analysis, and it can be seen that here we are actually ‘decomposing’ the ‘signal’ into its frequency spectrum, over time. The process of decomposing a function into its constituent frequencies is known as Fourier transform. You can have a ‘hands on experience’ at what a square wave ‘looks’ or ‘sounds’ like and how a periodic wave is decomposed into its constituent parts here. Do experiment on the sine, cosine, triangle wave and square wave functions as well and turn on the sound of your PC while you are at this site!

While Fourier originally devised this to solve the problem of heat propagation, the impact of Fourier analysis can now be felt in almost every field of science, instrumentation, entertainment and telecommunications, and even arts. Whenever you use your audio graphic equalizer to suit a piece of musical performance to your taste, you are doing a Fourier. Here you are boosting some particular audio frequencies while suppressing others, obtained by a Fourier analysis of the audio signal. You are assigning relative weights to the frequencies by sliding those sliders. Likewise, when you compress a picture (graphic) file using software such as JPEG, an inbuilt program does a Fourier transform,--> eliminates the weaker components from the analysis and--> then saves the information in a compact way.

In Nuclear Magnetic Resonance Imaging (NMRI), the emitted radio frequency is Fourier transformed to give frequency versus time, throwing valuable information about nuclear spins. Fourier analysis may also be employed to remove mains AC hum frequencies, in mobile telephony and many other situations.

One day, we may expect, that Fourier analysis may be used to pick up the ‘right frequency’ in the brain EEG waves and may put the study of ‘mirror neuron’ and ‘thought controlled devices’ into a whole new domain.

Last modified: May15, 2013
Reference:
Fourier analysis (Wikipedia),
Explained: The Discrete Fourier Transform

March 30, 2009

Build Yourself a DIY AM Radio Transmitter

diagram of a very simple, miniature medium wave amplitude modulation radio transmitterIntroduction: Understanding the fundamental principles of radio waves, their generation, propagation and reception is essential not only for the electronic enthusiasts, but also in other disciplines of science which employ radio-frequency (RF) in scientific investigation and even in medical imaging and treatment. Here, the construction of a cheap and simple DIY (do-it-yourself) transmitter (Tx) circuit is described and its operations explained in simple terms.

Materials you'll need: A microphone, a transistor (ask your friends to help with the emitter, base and collector terminals. Alternatively, look up the web), a radio frequency coil (choke, RFC), a variable capacitor (365 or 500 pF; pF = pico farad), 2 resistors, 3 condensers , an aerial (antenna), a soldering iron, solder wire, a stripboard (also known as veroboard) and a power supply (9V).

Assembly: Clean the leads (wire terminals) free of oxides/ enamel coatings by rubbing with fine grained sandpaper. Next, in accordance with the accompanying diagram, wire the components together in one of the following ways:
1. Connect the components directly and cover these joints by insulating tapes such as black tapes, cello tapes or scotch tapes (it is said that the scotch tape emits X-rays when pulled off, well it's unimportant here) . This will prevent accidental shorting with similar joints.
2. Or use a breadboard and press-fit the leads in the slots. The breadboard has prewired connections within it, which will take care of the rest. Make sure that these prefixed connection layouts are followed. You may need to make some extra connections by using external hook-up wires/jumpers.
3. Or use a stripboard/veroboard: Put the components into the drilled holes according to the circuit layout. Now, solder the leads using a 20 watt soldering iron. It is the best option among the three mentioned.

When the iron is sufficiently hot, apply the hot tip to the component lead (not to the solder wire!) to be soldered, and bring the solder wire near it. Within a few seconds, solder will melt and flow evenly around the joint. Withdraw the iron (take as little time as possible).
Check with the circuit again. Cut any extra strip of copper track which might act as a potential short. You may need to make some extra connections by using external hook-up wires/jumpers.

Turn on your radio: Set your radio receiver to any empty slot on the medium wave frequency band. Switch on your newly assembled wireless Tx. Turn the spindle of the variable condenser of 'your set'. At some point you'll hear a 'smooth hissing carrier tone' on the receiver. Keep the variable capacitor there. You're almost done! Speak on the mike, you'll hear the same on the radio receiver. If you press the mike on your left chest, you will hear your heart sounds on the receiver set. You can make a 'phonocardiogram' too this way.

How it works: The Tank oscillator produces the carrier frequency (freq = 1/{2*pi*sqrt.[LC]}; L= inductance of the coil in Henry, C = capacitance in Farad, as dictated by the variable capacitor). To see an animation of how a 'tank circuit' works visit this page. The amplitude of the freq. of the carrier wave is modulated by the input from the microphone. As we speak on to the microphone, the diaphragm vibrates. This makes a coil of copper, wound around a powerful magnet, vibrate too, making induced current in the coil, the magnitude and frequency of which depends on the loudness and frequency of the speech/audio signal. The mike is connected to the base of the transistor via a capacitor. This capacitor allows AC (alternating currents) to pass, but blocks any DC component. The second feature thus, does not let the microphone change the bias voltage conditions of the transistor. The biasing of the NPN type transistor is done by one or two fixed resistor networks (one in this case).
When some audio signal is present, collector current will increase. Since it is the tank circuit at the collector load, the amplitude of the 'carrier frequency' will thus be modified. Amplitude Modulation has been achieved! You will notice that one end of the output capacitor has been connected to the antenna, while the other end is connected to the ground (earth, ground of your wall power outlet, or safer still the traditional lead water pipe). This arrangement makes the capacitor plates look like, as if, they are placed far apart; earth and sky! This causes dissipation of the energy in the form of electromagnetic waves.
Frequency Modulation (FM) transmission is better, since the static (electrical noise from man made appliances, lightnings etc) is almost absent and stereo signal can be transmitted, to name a few.

Experiments and lessons on it:
1. Move a magnet at the back of the radio receiver (where the RFC choke is located) with the receiver tuned to the short wave band. You'll notice that the frequency changes: many different stations come in (without even having to turn the tuner knob!). This happens as the magnet alters the local oscillator of the receiver.
2. Put the radio inside a metal container and try to catch a station. You won't succeed. This is 'shielding'; the metal does not allow electromagnetic wave to pass in. Co-axial cables exploit this phenomenon to avoid noisy interferences. Sensitive instruments used in medicine (e.g. EEG) or radioastronomy were often built underground. This phenomenon is exploited in a Faraday cage.
3. Just touch two different metals in front of the radio receiver: the radio will make noise. This is due to passage of free electrons between the metals.
4. Short two ends of a battery (cathode and anode), the radio hisses and makes noise. Obviously, electromagnetic fields are created.
5. The telltale undulations heard in shortwave, is due to the reflection (actually total internal reflection, a type of refraction) of radio waves from the Kennely-Heaviside layer of the ionosphere, a charged layer in the higher atmosphere, that frequently changes its altitude. If you put a laser beam or any light on the ground and put a mirror higher up, you would get a reflection. Moving the mirror up and down will put the reflected beam closer or further away (light is also an electromagnetic wave). This layer is absent in night time and Appleton layer still higher up reflects then. This is why SW broadcasting stations are best heard at different frequencies during different parts of the daytime.
6. You can listen to cosmic noise, falling meteors (by their 'heated' ionization trail) etc.
7. Take a radio and tune it to a station. Now take a second radio and turn the tuner knob till that same radio station is obtained. You'll notice a drop in volume of the former radio (and vice versa). This illustrates energy transfer by resonance.

Uses of Radio waves: Telecommunications, radar, radioastronomy, medical investigations such as MRI (NMR), medical therapies (radio frequency ablation in ectopic pacemakers of the heart (electrophysiology), short-wave diathermy, research procedures such as thought broadcasting etc.

N.B. : 1. This is a very simple, low cost transmitter, but many countries might have legal restrictions on it. A crystal controlled version of the set is more likely to be approved, as the bandwidth is less.
2. Other forms of electromagnetic waves may be broadcast in much the same way e.g. our good old TV remote uses infrared waves.

Last modified: Mar10, 2014
Reference: hyper-links, unless specifically mentioned

December 05, 2008

PET Scan: Particle Physics And Electronics in Medical Imaging

Numerous imaging modalities are there to view anatomical structures in our body. They include X rays, Ultrasound imaging, MRI and many other procedures where we can see normal or diseased tissues in our body. They tell us ‘the location’ (position) in the body the image corresponds to. If we wanted to see what were happening in these locations, we would then need to perform functional imaging techniques like PET scan or fMRI.

In Positron Emission Tomography or PET, a radioactive isotope that decays by positron emission is introduced into the body. Positron emitting radioisotopes are prepared by bombarding stable atomic nuclei by protons. Protons are speeded up in a particle accelerator called cyclotron which then impinge upon the stable nuclei, and knocks out one neutron from its nucleus. The proton now occupies the position where the ousted neutron once stayed. But this atomic configuration is unstable, so the proton now decays. It decays by emitting positron, a particle resembling an electron in all aspects except that the charge is positive and not negative. In other words, a positron is an antimatter: an anti-electron.

positron annihilation and formation of two collinear gamma ray photonsMany different radioisotopes are there, such as Fluorine18, Oxygen15, and Carbon11. 18F is the most commonly used isotope. It replaces hydroxyl (OH) group in molecules of interest. We can use 18F Fluorodeoxyglucose (18FDG) an analog of glucose for probing the activity of brain. Our brain uses glucose for its metabolism, so when it encounters 18FDG, it stores them. The FDG in the brain begins emitting positrons. These particles travel only a short distance before they meet nearby electrons and annihilate. Two gamma ray photons, each having 511 keV of energy are produced--- Photons because they are electromagnetic waves, and gamma ray because the frequencies correspond to the gamma ray spectrum of electromagnetic waves.

So by detecting these photons, we can find out where they came from, since we know that these photons are emitted back to back, 180 degrees apart. (They aren’t exactly collinear as their initial velocity is not zero, and some computational error always creeps in). For the detection part, we need a detection array which will convert these photons into electrons. This is done by scintillators. Bismuth germanate, Luterium oxyorthosilicate (LSO) are some of them. Photons which are incident on them produce electrons by photoelectric effect. These electrons are then guided through a vacuum tube, which has many positive electrodes (dynodes) held at successively higher voltages. These dynodes of this photomultiplier tube accelerate these electrons, which in turn knock-off more electrons from the dynode plates. Thus we get more electrons than what we started with. The signal has now been amplified and we now have a measurable current.

With advancement in detection technology, silicon avalanche photodiodes (silicon APD) has now shown promise to replace the vacuum technology (photomultiplier tube). As the name suggests, APDs work in a similar way an avalanche gains its momentum as it descends from the mountain-avalanche effect. Detecting photons aren’t sufficient. We need to detect only co-linear (coincident) photons. Each collinear photon pair (i.e. 180 degrees apart) will constitute an event. All other photons (noise) must be rejected. About 10^7 to 10^8 or more ‘events’ must be registered in order to have a good signal to noise ratio. Image faithfulness varies proportionally with the square root of the number of events.

By acquiring a large number of events, the computer software is able to determine exactly where these radioactive tracers are located. This, in our case, means the locations where the neurons are accumulating (accumulation is a function of utilization of glucose) 18FDG. Thus we get a functional map. In order to know ‘what’ these structure were, we need to combine anatomical imaging like MRI or CT with PET. This combined PET-CT or PET-MRI let us know what structures are doing how much.

PET scan is very useful in neuroscience researches, clinical diagnoses like cancer detection, receptor analyses and even watching gene expression in molecular biology.

References: A good site with animation: PET animation
Physicsworld

Last Mod: 10 Mar, 2014

December 03, 2008

Peripheral Clocks Synch With The Master Zeitgeber

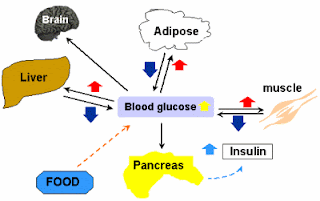
glucose metabolism and homeostasisIn our bodies there are clocks in addition to the Master clock located in the suprachiasmatic nucleus. In computers, there are multiple clocks too, and they are tightly coordinated. For example, Integrated circuits like AV 9155 generate multiple clock frequencies for different portions of a computer (e.g. bus clock, CPU clock, keyboard clock etc.). All these clock frequencies are well regulated, since ICs like AV9155 use 2 quartz crystals (14.318 MHz) which generates of all these frequencies (they have inbuilt circuitry for dividing/multiplying these frequencies to create other necessary frequencies).

Our bodies have their own version of these ‘crystal oscillators’, the BMAL1/CLOCK heterodimer. Since genes are present in all cells (leaving aside germ cells for a while, since they are haploid, and chiasma formation gives rise to gene rearrangement), theoretically all cells also has the machinery for BMAL/CLOCK generation. Thus in the periphery, where these genes are expressed, circadian oscillating mechanisms are automatically incorporated.

The role of peripheral circadian clocks is still uncertain. But it is known that the peripheral clocks regulate cell division, estrous cycles and glucose and lipid homeostasis. Lamia et al knocked out the BMAL1 gene in mice liver and observed that the liver was no longer able to pour sufficient glucose into the blood circulation for cellular activity, resulting in hypoglycemia. Normally, the liver produces glucose from lipids and amino acids in a process called neoglucogenesis; and from glycogen, a glucose polymer, by glycogenolysis, in the fasting phase, to make up for the dwindling blood glucose level. In liver specific BMAL1 deletion, this did not happen and the animal suffered from hypoglycemia, indicating the important role of the liver peripheral clock.

These peripheral clocks certainly need to be regulated too in order to achieve physiological harmony. The master clock in the suprachiasmatic nucleus might regulate these peripheral clocks by hormones and hemodynamic cues.

Gatfield et al used two groups of mice and inactivated BMAL1 in all their cells in one group (BMAL1-/-); and only in liver cells in the other group (L-BMAL1-/-) [the 2 minus signs indicate homozygous, or in both alleles, deletion/inactivation]. The mice in which all BMAL1 were deleted did not show any problem which glucose homeostasis, whereas those with only liver specific BMAL1 deletion had problem maintaining normal sugar level in the inactivity (fasting) phase. Thus the role of liver clock is undeniable. The hepatic oscillator synchronises on feeding cues, since feeding is related to circadian metabolism. In the L-BMAL1 knockout mice, both neoglucogenesis and glycogenolysis operated adequately, but the machinery for the pouring of glucose into the circulation, the final step that is carried out by glucose transporter 2 (GLUT2) is suboptimal. GLUT2 expression in L-BMAL1-/- rats is inadequate.

In BMAL1-/- mice, the master clock in the SCN was inactive along with all other peripheral clocks. This presumably abolished the circadian feeding responses and thus glucose homeostasis was minimally affected. It is as if both the SCN (master) and liver (slave) clocks gone wrong and they were fully asynchronous. But in the L-BMAL1 knockout mice, the SCN was OK and it expected the desired blood glucose level in the habitual feeding time, but the liver lacked GLUT2 to supply the required glucose in the bloodstream. UNITED WE STAND, we better synch!

Last modified: never
References:
Physiological significance of a peripheral tissue circadian clock. Katja A. Lamia, Kai-Florian Storch, and Charles J. Weitz  doi:10.1073/pnas.0806717105

BMAL1 and CLOCK, Two Essential Components of the Circadian Clock, Are Involved in
Glucose Homeostasis. R. Daniel Rudic , Peter McNamara , Anne-Maria Curtis, Raymond C. Boston, Satchidananda Panda, John B. Hogenesch, Garret A. FitzGerald doi:10.1371/journal.pbio.0020377

ResearchBlogging.orgD. Gatfield, U. Schibler (2008). Circadian glucose homeostasis requires compensatory interference between brain and liver clocks Proceedings of the National Academy of Sciences, 105 (39), 14753-14754 DOI: 10.1073/pnas.0807861105

November 20, 2008

Hearing Involves Sound Physics

Ear showing ossicles, round window and oval window
The way we hear sound is complex. The different attributes of sound (namely, intensity, frequency, the direction from which it is coming etc.) are faithfully perceived in the auditory cortex. The whole procedure may seem rather straightforward, but it is far more complicated than what looks so deceptively simple.

The sound waves (say from an orchestra) impinge on our eardrums. Sound waves are mechanical waves consisting of condensation and rarefaction, things we learned in our school days. These waves then vibrate our eardrums (Tympanic Membrane; TM). The TM is critically damped, meaning any vibration that is set in will stop almost instantaneously. The vibrating TM then transfers its mechanical energy to the oval window, in the membranous labyrinth of the cochlea, via an ossicular chain consisting of three (3) very small bones.

Basilar membrane, organ of Corti and the scala vestibuli,media and tympani, phalangeal cellsThe membranous labyrinth consists of three adjoining tubes coiled side by side (as shown in the figure). If we were to make a section through it, we would find 3 separate compartments within it: Scala vestibuli, Scala media and Scala tympani. Scala vestibuli is connected to Scala tympani at the apex of the cochlea, a place called helicotrema. While Scala tympani contains a fluid called endolymph (a fluid rich in K+ or potassium ions); the other 2 tubes contain perilymph (a fluid very similar to plasma, rich in Na+ and low in K+). The sheer asymmetry in K+ distribution among the two adjacent fluids (endolymph and perilymph) generate an endocochlear potential of about +80mV, endolymph positive when the perilymph is considered as 0 (zero) volt or ground.

As the oval window vibrates, the fluid in Scala vestibuli (perilymph) also vibrates. Sound was traveling in air before it struck the eardrum, but here, we see that they are now propagating in a fluid medium, which has far more inertia than air. The possible impedance mismatch that would happen is compensated by the eardrum itself and the ossicular chain. The mechanical advantage of the lever system of the ossicular chain, together with the ratio of surface areas of TM and the 'oval window', amplifies the force of sound waves about 22 times, so that the total force at the oval window is 22 times than what the TM experienced originally.

Now, vibrations have set up in the Scala vestibuli form the oval window. These vibrations find their way to the Scala media, as the two tubes are separated by only a very thin membrane (Reissner’s membrane). Hence, fluid in the Scala media (endolymph) vibrates whenever the oval window is vibrating. This Youtube video beautifully illustrates it.


The vibrating endolymph sets up a wavy motion in the basilar membrane (BM). The ‘real analysis’ of sound waves starts here! The BM performs real time spectral analysis of sounds it is presented with (analysis of frequencies below 200Hz is skipped though). We normally hear in the frequency range of 20Hz to 20 kHz.

The hair cells in the organ of Corti, our hearing apparatus, are arranged in such a manner along the BM that those near the base of the cochlea will respond to high frequencies; while as we go up to the apex of the cochlea, the BM reacts best at low frequencies. In other words, each part of the BM has its own unique maxima, the frequency at which the BM responds most well. Below 200Hz, there is no such place encoding.

traveling wave in the basilar membrane
Our ears follow another principle. The ‘traveling wave’ spreads quicker near the base of the cochlea and its speed diminishes fast as it goes up. This ensures that a longer stretch is available for the higher frequencies; else the higher frequency part would have been bunched together, creating a loss in the HF range. This non linearity in traveling wave propagation is thus needed.

Generator Potential
Tip links of hair cells of the earThe genesis of generator potentials in the hair cells is also interesting. Imagine that a group of persons of varying height are standing on a carpet. A thread is attached from the top button (of his shirt) of the smaller person to the top button of his taller counterpart. If the carpet is now tilted by pulling it up from the short person’s end, the thread will now be stretched snapping the taller person’s button. The hair cells also have threads (Tip Links) extending from shorter to their taller cousins. A traveling wave will cause pulling of tip links, resulting in the opening of a mechanically sensitive cation channel. Since potassium is the predominant cation in the endolymph, K+ will then enter the taller hair cells. Look at the electrical gradient around the hair cell; it is -140mV with respect to the endolymph (it is about negative 60 mV wrt the perilymph). So, cations, specially K+ rushes in  creating depolarization. A cascade of events like opening of voltage-gated Ca++ ion channels at the base, consequent fusion and exocytosis of vesicles discharging neurotransmitters, probably glutamate to the afferent cochlear nerve endings surrounding the hair cells, creating an action potential in the nerve.

Frequency Discrimination
When we listen to music, our ears pick up the frequencies in a number of ways. Firstly, the place (maxima) on the BM where maximum excitation takes place is actually a function of frequency. As a matter of fact, there is a frequency map along the BM. Secondly, at frequencies below 3 kHz, the nerves fire in synchrony with the incident sound waves. This is called the ‘volley principle’. The ‘phase locking’ of the two frequencies that occurs below 3 kHz, is highly analogous to the ‘phase locked loops’ in electronic circuits (NE565). Thus ‘volley principle’ allow us to discriminate frequencies. Actually, volley effect is more important in ‘loudness’ assessment. ‘Pitch’ (the subjective/psychological dimension related to frequency) are also moderated by factors such as loudness and the duration of sound. At low frequency (below 500 Hz) pitch seems lower and at higher frequencies (above 4 kHz) pitch seems higher, as the loudness increase, when the frequency is kept constant. Again, when the duration of sound increase from 0.01 second to 0.1 second, the pitch will rise too, for a particular frequency. Sound of less than 0.01 sec duration does not evoke appreciation of any pitch by us.

Loudness Discrimination
Loudness is the perceived intensity of sound, a subjective psychological dimension. The interpreted sound sensation is proportional to the cube root of the actual sound intensity. As such, the ear works at the top of its limit, at a point analogous to Hopf bifurcation, beyond which instability in oscillations occur.
As the sounds become louder, the amplitude of BM movement is more, resulting in more excitation of hair cells. Secondly, with greater loudness, the hair cells around the ‘maxima’ fire too. This causes spatial summation. Thirdly, the outer hair cells are stimulated at loud sounds. The brain will automatically infer loudness levels when cells corresponding to the outer hair cells fire.

Locating Sounds
Then there is location of the direction of sound. We can locate whether the drums are on the left and the lead guitar is to the right. This is achieved by calculating which ear gets the sound first (time lag) and/ or which ear gets it louder (intensity). The time lag method works below 3 kHz; while intensity method works at higher frequencies.
Front/ back discrimination is done by the pinna (auricle) of our ears due to their particular shape.

Auditory nerve
It is interesting that each auditory nerve fiber has its own characteristic frequency, the frequency at which it responds most well. However, it is true only at low intensity. At higher intensities, this specificity is lost and they then respond to a wider spectrum of frequencies. The auditory nerve produces a flurry of action potentials, the frequency of which depends on the intensity of the sound stimuli, it is exposed to. This is very much similar to ‘voltage to frequency converter’ ICs (LM331 is one such VFC IC), where a change in voltage at the input of VFC will cause a change in frequency at the output.

The auditory nerve then goes to the: cochlear nucleus in the medulla to Superior olivary nucleus to Inferior colliculus (via lateral lemniscus) to Medial Geniculate Body (in the Thalamus) to end in Auditory cortex. Some fibers cross to the other side early in their course while others cross at other levels. Fibers from primary auditory area sends association fibers to different parts of the brain for language processing and other tasks.
The nerve synapses with higher order neurons in the above places, which then relay to the nerves upstream. Everywhere in its course, including the nuclei, there are clearcut ‘tonotopic maps’, representing definitive frequency layouts. There are also extensive crossing of nerve fibers to the opposite side. Before the fibers reach the auditory cortex, they connect to many reflex pathways vital to life. For example, they send branches to the reticular activating system which keeps us awake during the noisy hours.

The auditory cortex (Brodmann’s area 41) is the portion of the cerebral cortex in the superior temporal gyrus. Its anterior part is mainly concerned with low frequency and the posterior part tackles the higher frequencies. Thus area 41 also has its own tonotopic map. Secondary auditory cortex (auditory association area) is vital for the interpretation of sounds. A person, in whom Wernicke’s area (part of auditory association area) is damaged, will hear normally but will fail to understand its meaning, leading to aphasia.

The sheer complexity of the auditory circuitry is really mind-boggling: the logarithms (we hear in a log scale, not a linear one), cube functions, phase locking are only some of them. The range of sound intensity (from whisper to the roar of a jet plane) we hear is about 1 trillion fold; but surprisingly, the auditory nerve fibers have a much less dynamic range. Yet we hear the full range. It’s really amazing.

ResearchBlogging.org
P. Martin (2001). Compressive nonlinearity in the hair bundle's active response to mechanical stimulation Proceedings of the National Academy of Sciences, 98 (25), 14386-14391 DOI: 10.1073/pnas.251530498

Last modified: Mar 10, 2014
Reference: Textbook of Medical Physiology, 17e, Guyton and Hall