It is said that the eyes are the windows to the soul, though science is yet to prove that given the elusive nature of ‘soul’. But researchers has now been able to probe genes in a traumatized brain using the eyes as a gateway.
The brain is normally ‘secured’ from the circulating blood directly, so that endogenous and exogenous toxic substances, macromolecules can not gain entry easily into (and out of) the brain. More importantly, this ‘firewall’ like barrier, called the ‘blood brain barrier’ maintains the constancy of ions inside the brain such as K+, H+, Mg++, Ca++, which is vitally important for the neurons to function normally.
The ‘blood brain barrier’ (BBB: see picture) results from the ‘relative’ impermeability of both the capillaries supplying the brain as well as that of the ‘choroid plexus’ covering the brain. Actually, the endothelial cells of the capillaries are tightly packed (tight junctions) and they are non-fenestrated too. In addition, end feet of astrocytes, a type of glial cells (cells that support and aid neurons), cover these capillaries.
But there are disease conditions in which the BBB becomes leaky. For example, in traumatic brain injury, cardiac arrest, stroke and multiple sclerosis the blood brain barrier is breached, to different extents. In Alzheimer’s disease too, there is thinning of the capillaries as the disease progresses. As expected, the supporting glial cells, particularly the astrocytes, jump into action to seal the leaks. They proliferate, resulting in ‘gliosis’. Gliosis is also found in a tumorous condition of the glial cells called ‘glioma’.
These glial cells contain a protein in them called the glial fibrillary acidic protein (GFAP). Naturally, there is an mRNA for it that ‘translates’ its formation in the cytoplasm. Scientists target this mRNA molecule because tagging it will track the GFAP and consequently the astrocytes in whom GFAP is expressed.
Previously scientists had to inject MR contrast agents intra-cerebro-ventricularly or by other invasive techniques to map these leaking areas. Scientists at Harvard embarked on a novel idea. They produced a short cDNA sequence ‘complementary’ to the mRNA of GFAP. This short stretch of this ‘antisense’ oligodeoxynucleotide (ODN-gfap) would latch onto the GFAP mRNA just as a lock would to its key. They then tagged it with a paramagnetic molecule that they designed, called superparamagnetic iron oxide nanoparticles or SPION, a magnetic resonance susceptibility contrast agent. The SPION-ODN ‘report’ any inhomogeneity in transverse magnetization in ‘T2 star’weighted MRI scan, due to the paramagnetic properties of iron oxide. Liu et al also used a sequence complementary to the mRNA of beta-actin as well (actin is the most abundant protein in mammalian cells and its mRNA is found in all types of cells) to act as a ‘control probe’.
They then anesthetized the mice, the animal model they selected; and caused BBB leakage by inflicting a small puncture or by performing bilateral carotid artery occlusion (BCAO) for 60 minutes. They also tried other methods (see reference). They subjected another group of mice to a sham (=false) operation (no puncture or vessel occlusion but the same operation) at the same time. BBB leakage was checked by T1 weighted Gadolinium-DTPA contrast MRI scan. Gd-DTPA was injected into the jugular veins of the mice. Leakage would show up as enhanced areas on T1 weighted scan (normally Gd-DTPA does not cross the BBB). Due to repair process to seal the leak, glial cells would be recruited and gliosis would result.
The telltale signature of gliosis (and BBB breach) may be found in postmortem tissue samples of the brain. Previously, the GFAP antigen was detected by immunohistochemical methods. But the Harvard team was looking for a non invasive method to detect GFAP. They instilled ‘SPION-ODN gfap’ reporter into the conjunctival sac of the mice by means of eyedrops. They then measured the ‘T2 star’ values in MRI scan and transformed the values to ‘R2 star’ maps (R2 star = 1/T2 star). Areas of leakage showed up as elevated (hyperintense) signals in R2 star maps. It corroborated well with Gd-DTPA scans and also on post mortem examination. SPION-beta actin, the control probe, got bound to the endothelial cells of the vasculature as expected.
The eye drop was absorbed by the lymphatics draining the palpebral (eyelid) and bulbar conjunctiva. The lymphatics then transferred the reporter probe into the veins which finally found their way into the brain. Since the BBB was breached, it finally came out of the circulation into the brain parenchyma. As the probe is detecting mRNA which is ‘transcribed’ from the DNA of the cell, it may be said that they are, in a sense, detecting the genes for GFAP.
Thus we may hope to detect gliosis, a pathology that occurs in a variety of diseases already mentioned, non invasively, the ophthalmic way.
Last modified: never
Reference: Liu, C., You, Z., Ren, J., Kim, Y., Eikermann-Haerter, K., & Liu, P. (2007). Noninvasive delivery of gene targeting probes to live brains for transcription MRI The FASEB Journal, 22 (4), 1193-1203 DOI: 10.1096/fj.07-9557com
Physiology is like software, while anatomy the hardware in human bodies. Physics, including biophysics, can explain many mechanisms of these 'software operations', in physiology and other allied medical disciplines. This blog emphasizes on this analytical approach.
September 19, 2010
September 11, 2010
fMRI, BOLD and the Beautiful
When we want to examine the brain of a person noninvasively by Computed Tomography (CT) or MRI, we get a ‘snapshot’ of the anatomy (or pathology, if any) of the subject’s brain. We are however clueless as to its functional aspect. fMRI or Functional Magnetic Resonant Imaging allows us to do just that. The difference is not unlike a ‘still picture’ versus a ‘video of a moving train’. PET scans, previously described, also can asses the functional state of the brain.
Whenever we do a task, think, dream, memorize, speak or see things, the brain is not activated as a whole; but only certain portions of it are activated. Activation, here, means increased metabolic activity of neurons in certain areas of the brain. Naturally, these ‘metabolically active’ neurons would demand more energy which would power them. The blood supply to these areas increases as a result of this metabolically driven vasodilation. The arteries then bring in glucose and oxygen with them, with Oxygen being transported in the form of Oxyhemoglobin (oxygenated hemoglobin or HbO2). Neurons on the other hand use up the oxygen contained in the blood, thereby reducing it to de-oxyhemoglobin or simply Hb. However, the alteration in tissue perfusion exceeds the extraction of oxygen by the neurons, so the concentration of deoxyhemoglobin within ‘the areas’ decreases. This causes molecular inhomogeneities in the magnetic field.
Oxyhemoglobin is diamagnetic, meaning that they align perpendicularly to magnetic field lines. On the other hand, deoxyhemoglobin is paramagnetic, i.e. it aligns parallely and proportinately with the intensity of the magnetic field. This causes the inhomogeneity within the magnetic field (magnetic susceptibility) in the tissue sampled. This inhomogeneity is exploited in fMRI in terms of decay of transverse magnetization, T2*, with longer T2* values in HbO2 blood and shorter values in Hb (paramagnetic) blood.Since this stems from the oxygen content in blood, fMRI is also known as the BOLD ((blood oxygenation level dependent) effect.
The machine is essentially the same as the MRI machine with echo planar imaging technology that permits faster imaging due to faster gradient switching, improved algorithm and faster CPU processing power. The patient/subject is placed inside the magnetic chamber and MRI signals are acquired, Fourier transformed and corrected for artifacts. Finally the computer reconstructs a 3D fMRI image out of this.
As is obvious, we can learn about the motor areas of a patient by asking him to grasp an object or giving him any motor task and noticing which area(s) of the brain lights up. A neurosurgeon can then be cautious about not hurting these areas. Similarly, the mapping will help spare motor and other vital areas like auditory, visual and language areas from damage in radiotherapy procedures, in addition to neurosurgery. It can also detect occult Alzheimer’s disease and cognitive deficits including those of the autism spectrum and dyslexia (reading disorder).
fMRI can also be employed to ‘read peoples’ minds’, thoughts, intentions including lie detection. Watch the video below which explains how an fMRI scan is done and interpreted.
Thus the legal and forensic implications are obvious. However, in fMRI, correlation doesn't always mean causation. Whatever it may be, it seems that fMRI is very much here to stay, both in the clinics as well as in cognitive neuroscience research. It may also be combined with tractography, MRI or other diagnostic radiologic modalities.
Hardenbergh et al combined Tractography techniques with fMRI, using a technique capable of rendering multiple color-coded functional activation volumes and fiber tract bundles. Many pharmacologically active drugs have effect on memory impairment, which can be seen in ‘telltale’ fMRI scans. Sperling et al studied the effects of lorazepam (a benzodiazepine) and scopolamine (an anticholinergic drug once used as ‘truth serum’ by the CIA) on healthy volunteers and found that they did impair memory and their functional coordinates could be reproducively mapped on fMRI scans (see figure on the left). I still shudder at the thought of what happened during my PG exam when I took a benzodiazepine.
Last modified: Mar 09, 2014
Reference: Integrated 3D Visualization of fMRI and DTI tractography
Gore, J. (2003). Principles and practice of functional MRI of the human brain Journal of Clinical Investigation, 112 (1), 4-9 DOI: 10.1172/JCI200319010
September 07, 2010
The World of Tractography Where The White Matter Tracts Appear Colored
The Central Nervous System (CNS) communicates with the exterior (sensory e.g. gets visual, tactile information etc. on the one hand; and motor, performs limb movement, posture regulation etc. on the other) via the peripheral (somatic) nervous system. It also connects with the interior (our viscera or organs) via the Autonomic Nervous System. That is, it does its job in a bidirectional way: by the motor or the actuator arm, and sensory or the receptor arm. For such ‘actions’ to occur, cables of nerve fibers are laid within our body. Wouldn't it be nice if we could visualize these cables, their dispositional anatomy or any pathology that could afflict them?
The brain and spinal cord together constitute the CNS. We also know that there are about a hundred billion neurons in the CNS. Each neuron has a cell body (soma), an axon wrapped by myelin, and many dendrites. (See figure). It is the axon that carries the information in the form of action potential. These cables (bunch of axons, called tracts) are not laid haphazardly. Nature tries to conserve space, length, energy and so on and thus the axons form into tracts in a topologically efficient way. They run up and down (also front-back and sideways) the cord to the brain, the organ that we will now concentrate upon.
Your electrical wiring to your ceiling fan would include a switch and the fan itself. The wire (cable) from the switch would ascend vertically up the wall, make a 90 degree angle, and then reach the fan horizontally up in the ceiling. Likewise, in our brain, which is made up of two hemispheres, would connect. Three broad fiber types are seen: from one hemisphere to the other (commisural fibers), restricted to one hemisphere (front to back or antero-posteriorly are association fibers) and finally vertically (up down orientation go the projection fibers).
Exploring the tracts can now be done in live animals including humans. Improvement in MRI technology has enabled us to see the tracts (tractography). Improved gradient coils, faster processors and superior software have shortened the scanning time, thereby reducing 'blur' due to organ movement (e.g. diaphragm) and patient movement. This procedure called Echo Planar Imaging (EPI) has given birth to Functional Magnetic Resonance Imaging (fMRI), Diffusion Weighted Imaging (DWI), tractography and many other diagnostic and research procedures.
Consider the neuron shown in the above picture. Water molecules in the axon (yellow) are constantly in Brownian (random) motion due to thermal energy within. Hence they tend to diffuse constantly to come to equilibrium. In most of the cerebrospinal fluid spaces these microscopic motions are equal in all directions. This is called isotropic diffusion. But in myelinated neurons, as in the white matter fiber tracts, water motion is constrained due to the fatty nature of the myelin sheath (in blue) which hinders water flow across it. This anisotropic diffusion allows the flow of more water molecules along (parallel) the direction of the nerve fiber. The apparent diffusion coefficient (ADC) is thus more along the nerve fiber. Diffusion Weighted Imaging (DWI) can capture this microscopic water flow and delineate anatomically the orientation of nerve fiber tracts.
Pyogenic abscesses hinder diffusion by virtue of their increased viscosity, a rheological property. In the early stages of acute cerebral infarction there is reduced diffusion too, giving rise to high signal intensity. However, in most pathologies of the brain the ADC is increased. Diffusion Tensor Imaging (DTI), a diffusion MRI technology, tracks fiber orientation by assigning values in ellipsoid voxels (VOlume piXEL). Ellipsoid because unlike isotropic diffusion where molecules diffuse equally in all directions, the anisotropy in the white matter tracts does not permit them to move with equal ease in all directions, and hence the pattern is that of an ellipsoid and not spherical. By connecting the long axes of all the ellipsoids, the trajectory/orientation is deduced.
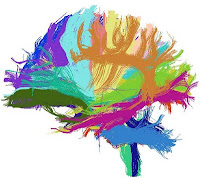
Colors are added to it with respect to the three principal axes (x, y and z) and the result is a stunning tractography! (see left)
The YouTube video below describes the colorful realms of tractography and how they are used.
When fMRI and DTI are combined together, a whole new world emerges. But, I prefer to keep it on hold till I discuss Functional Magnetic Resonance Imaging.
NB: The picture of the neuron/axon shown is not representative of CNS neurons. Oligodendrocytes that form myelin in the CNS does not encircle so many times as the Schwann cells in peripheral neurons do. It has been shown here only for the sake of clarity.
Last modified: Mar 10, 2014
Reference: Diffusion Tensor Tractography: Exploring the Cost-Benefit Ratio of Incorporating CSF Suppression into Fiber Tracing Algorithms
William P. Dillon. Neuroimaging in Neurologic Disorders. In: Harrison's Principles of Internal Medicine, 17th Ed., Volume 2, McGraw Hill; 2008. p. 2491-2497.
P. Mukherjee,, J.I. Berman,, S.W. Chung,, C.P. Hess, & R.G. Henry (2008). Diffusion Tensor MR Imaging and Fiber Tractography: Theoretic Underpinnings AM J Neuroradiol DOI: 10.3174/ajnr.A1051
Schematic of a 'peripheral' myelinated axon |
Your electrical wiring to your ceiling fan would include a switch and the fan itself. The wire (cable) from the switch would ascend vertically up the wall, make a 90 degree angle, and then reach the fan horizontally up in the ceiling. Likewise, in our brain, which is made up of two hemispheres, would connect. Three broad fiber types are seen: from one hemisphere to the other (commisural fibers), restricted to one hemisphere (front to back or antero-posteriorly are association fibers) and finally vertically (up down orientation go the projection fibers).
Exploring the tracts can now be done in live animals including humans. Improvement in MRI technology has enabled us to see the tracts (tractography). Improved gradient coils, faster processors and superior software have shortened the scanning time, thereby reducing 'blur' due to organ movement (e.g. diaphragm) and patient movement. This procedure called Echo Planar Imaging (EPI) has given birth to Functional Magnetic Resonance Imaging (fMRI), Diffusion Weighted Imaging (DWI), tractography and many other diagnostic and research procedures.
Consider the neuron shown in the above picture. Water molecules in the axon (yellow) are constantly in Brownian (random) motion due to thermal energy within. Hence they tend to diffuse constantly to come to equilibrium. In most of the cerebrospinal fluid spaces these microscopic motions are equal in all directions. This is called isotropic diffusion. But in myelinated neurons, as in the white matter fiber tracts, water motion is constrained due to the fatty nature of the myelin sheath (in blue) which hinders water flow across it. This anisotropic diffusion allows the flow of more water molecules along (parallel) the direction of the nerve fiber. The apparent diffusion coefficient (ADC) is thus more along the nerve fiber. Diffusion Weighted Imaging (DWI) can capture this microscopic water flow and delineate anatomically the orientation of nerve fiber tracts.
Pyogenic abscesses hinder diffusion by virtue of their increased viscosity, a rheological property. In the early stages of acute cerebral infarction there is reduced diffusion too, giving rise to high signal intensity. However, in most pathologies of the brain the ADC is increased. Diffusion Tensor Imaging (DTI), a diffusion MRI technology, tracks fiber orientation by assigning values in ellipsoid voxels (VOlume piXEL). Ellipsoid because unlike isotropic diffusion where molecules diffuse equally in all directions, the anisotropy in the white matter tracts does not permit them to move with equal ease in all directions, and hence the pattern is that of an ellipsoid and not spherical. By connecting the long axes of all the ellipsoids, the trajectory/orientation is deduced.
Colors are added to it with respect to the three principal axes (x, y and z) and the result is a stunning tractography! (see left)
The YouTube video below describes the colorful realms of tractography and how they are used.
When fMRI and DTI are combined together, a whole new world emerges. But, I prefer to keep it on hold till I discuss Functional Magnetic Resonance Imaging.
NB: The picture of the neuron/axon shown is not representative of CNS neurons. Oligodendrocytes that form myelin in the CNS does not encircle so many times as the Schwann cells in peripheral neurons do. It has been shown here only for the sake of clarity.
Last modified: Mar 10, 2014
Reference: Diffusion Tensor Tractography: Exploring the Cost-Benefit Ratio of Incorporating CSF Suppression into Fiber Tracing Algorithms
William P. Dillon. Neuroimaging in Neurologic Disorders. In: Harrison's Principles of Internal Medicine, 17th Ed., Volume 2, McGraw Hill; 2008. p. 2491-2497.
P. Mukherjee,, J.I. Berman,, S.W. Chung,, C.P. Hess, & R.G. Henry (2008). Diffusion Tensor MR Imaging and Fiber Tractography: Theoretic Underpinnings AM J Neuroradiol DOI: 10.3174/ajnr.A1051
Subscribe to:
Posts (Atom)